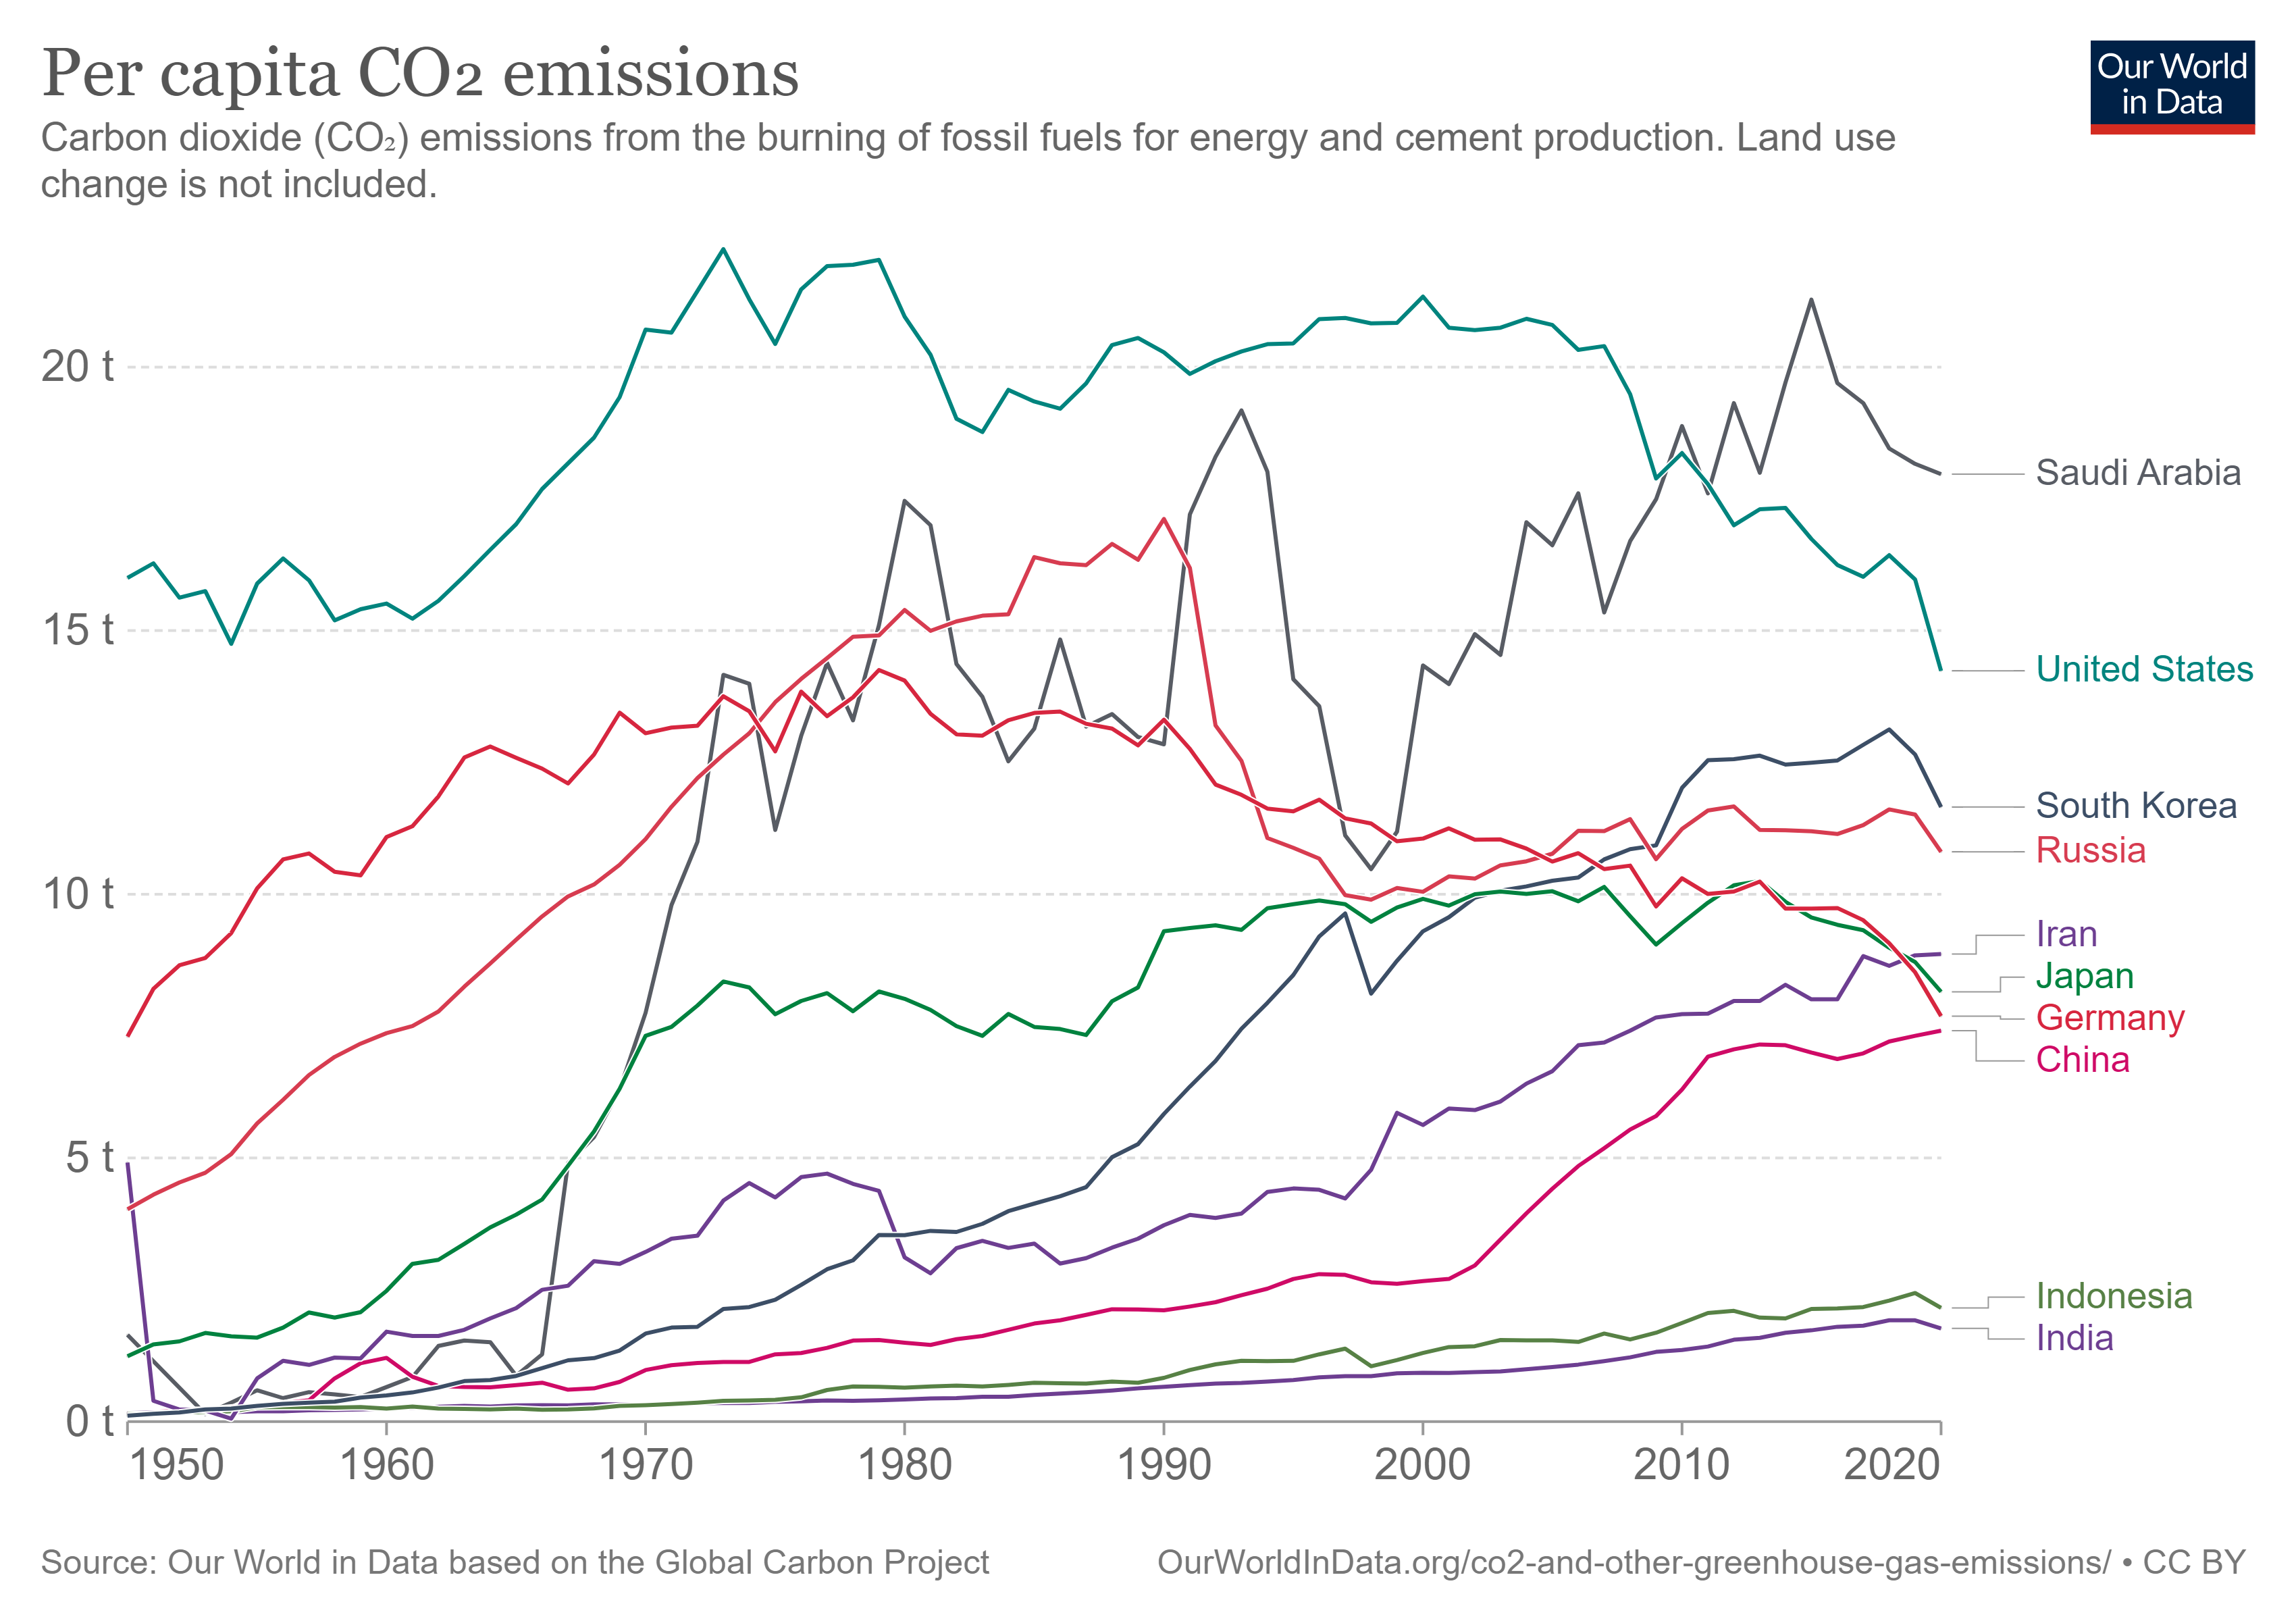
I downloaded per capita CO2 emission data from Our World in Data. Climate change is one of the biggest issues that my generation has to come up with solutions for quick. Rising levels of CO2 in the atmosphere are causing catastrophic changes that could ultimately lead the extinction of mankind if we don’t act as fast as possible. This data will be used to analyze ten countries and the amount they produced (per capita) from 1950 - 2020.
This is the link to the data.
The following code chunk loads the package I will use to read in and prepare the data for analysis.
- Read the data in.
- Use glimpse to see the names and types of columns.
glimpse(annual_co_emissions_by_country)
Rows: 24,032
Columns: 4
$ Entity                              <chr> "Afghanistan", "Afghanis~
$ Code                                <chr> "AFG", "AFG", "AFG", "AF~
$ Year                                <dbl> 1949, 1950, 1951, 1952, ~
$ `Annual CO2 emissions (per capita)` <dbl> 0.0019, 0.0109, 0.0117, ~- Use output from glimpse to prepare the data for analysis.
Create the object countries that is list of countries I want to extract from the data set
Change the name of the 1st column to Country and the 4th column to CO2emissions
Use filter to extract the rows that I want to keep: Year >= 1950 and Country in countries
Select the columns to keep: Country, Year, CO2emissions
Assign the output to country_co2
Display the first 10 rows of country_co2
countries  <- c("China",
               "United States",
               "India",
               "Russia",
               "Japan",
               "Iran",
               "Germany",
               "South Korea",
               "Saudi Arabia",
               "Indonesia")

country_co2  <- annual_co_emissions_by_country  %>%
  rename(Country = 1, CO2emissions = 4)  %>%
  filter(Year >= 1950, Country %in%  countries)  %>%
  select(Country, Year, CO2emissions)

country_co2
# A tibble: 708 x 3
   Country  Year CO2emissions
   <chr>   <dbl>        <dbl>
 1 China    1950        0.142
 2 China    1951        0.179
 3 China    1952        0.220
 4 China    1953        0.226
 5 China    1954        0.267
 6 China    1955        0.311
 7 China    1956        0.347
 8 China    1957        0.406
 9 China    1958        0.819
10 China    1959        1.11
# ... with 698 more rows- Check that the total for 2020 equals the total in the graph
# A tibble: 1 x 1
  total_emm
      <dbl>
1 90.7- Add a picture.
- Write the data to file in the project directory.
write_csv(country_co2, file="country_co2.csv")